Draw Multiple ggplot2 Plots with Consistent Width (Example) | Set Same Legend Size | cowplot Package
How to create a plot composition of multiple ggplot2 graphics with the same width in the R programming language. More details: https://statisticsglobe.com/draw-mult...
R code of this video:
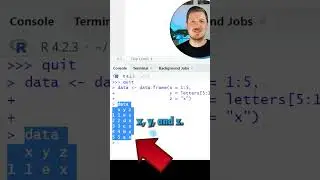
data <- data.frame(value = 1:3, # Create example data
group1 = LETTERS[1:3],
group2 = c("Loooooooong_A",
"Loooooooong_B",
"Loooooooong_C"))
install.packages("ggplot2") # Install & load ggplot2
library("ggplot2")
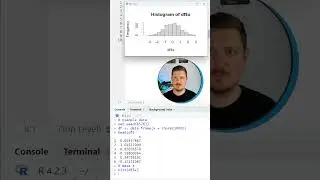
ggp1 <- ggplot(data, # Create first plot
aes(x = group1,
y = value,
fill = group1)) +
geom_bar(stat = "identity")
ggp1
ggp2 <- ggplot(data, # Create second plot
aes(x = group2,
y = value,
fill = group2)) +
geom_bar(stat = "identity")
ggp2
install.packages("cowplot") # Install cowplot package
library("cowplot") # Load cowplot
plot_grid(ggp1, ggp2, # Draw uneven grid of plots
ncol = 1)
plot_grid(ggp1, ggp2, # Draw even grid of plots
ncol = 1,
align = "v")
Follow me on Social Media:
Facebook – Statistics Globe Page: / statisticsglobecom
Facebook – R Programming Group for Discussions & Questions: / statisticsglobe
Facebook – Python Programming Group for Discussions & Questions: / statisticsglobepython
LinkedIn – Statistics Globe Page: / statisticsglobe
LinkedIn – R Programming Group for Discussions & Questions: / 12555223
LinkedIn – Python Programming Group for Discussions & Questions: / 12673534
Twitter: / joachimschork
Music by bensound.com
On this page of the site you can watch the video online Draw Multiple ggplot2 Plots with Consistent Width (Example) | Set Same Legend Size | cowplot Package with a duration of hours minute second in good quality, which was uploaded by the user Statistics Globe 15 August 2022, share the link with friends and acquaintances, this video has already been watched 890 times on youtube and it was liked by 28 viewers. Enjoy your viewing!



![DJ Liendro - Ponte Mix ( Arabian Remix )|| ►● NO-Copyright songs/music [BSNC MUSIC]](https://image.4k-video.cc/id-video/GgMjW2gGLAs)