5. How to add SliderInput functionality in R Shiny with adjustable data range selection?
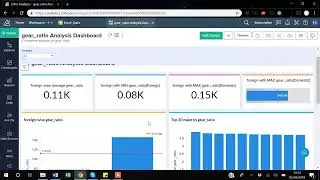
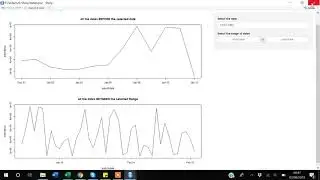
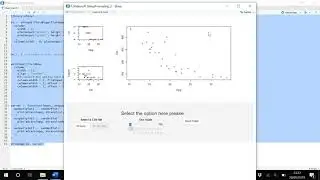
In today's video, we will talk about "How to add SliderInput functionality in R Shiny with adjustable data range selection". So before going towards the coding so this is a kind of our dashboard that we will try to construct today so the first thing is what is slider input actually slider inputs allow you to opt any value from a given range so suppose here we have that select the price in the data i know that the minimum price actually will be using our data to behind this dashboard so within that data i know that the minimum price of a car is 32 000 whereas the maximum car of the price of the car is 16 000 pounds and i have this slider can on the first slider which is saying the select the price can allow you to opt any price between uh 3 200 till to 1600 as you can see that i also have link whatever value you have off will be printed on on our main panel so if i of any value so you can see my slider input value also get changed so but in the first slider input i can only select one value at a time whereas there is another option in slider inputs in which you can select a range of values as you can see that by default i have selected 10 000 and 13 000 and if i change the values and it will also change the output results which is happening here as you can see now it's starting from 5003 to 7 and ending at 3 000 13 000 so but when you will so when you will be using a slider where you will be allowing to only of one value then the slider will uh generate a single scalar value just like we have 12 200 here but when you will be allowing uh to opt a range of values in slider input then the slider input will be actually capturing a vector with with two values in it as you can also see that in our second slider input we have a vector with two factors in it or two components in it whereas in the last thing is that i also have created a graph so actually in my data we have variable related to car prices and also about the mileage of the car so in order to see that is there any relationship between price of the car and mileage of the car so i have created a graph in which my y-axis is showing mileage paragraph whereas my right sorry x-axis is showing uh the price of the car what i have done is that i not only have just simply plotted this graph and put it in r shiny actually i linked this graph with my second slider input and suppose if i change the range of the price so if i say that only select the data from 3200 so till 13 000 so it's showing me the graph according to this range of prices so any data or any observation with the price between 32 000 and 1300 will be shown here any price which is above this 13 000 range will not be shown but suppose if i increase the rate you can see that my r shiny have i added new observation in the graph so you can focus on the range of price you want in order to see where the relationship between price or mpg is stronger so but actually this example is just to show you guys that how you can link your output result in terms of a graph or tabulations through slider input and then after that you can further add complexity in in it so the first thing is that we will start writing a code i will just close this window so and before starting don't save so actually i have created a folder uh for you for this video and we have we will be using this csv data set uh but probably in my later part of the videos we will come to the stage where we will be using this csv data so let's start writing a code so in order to write a code i will go to my r studio and now i need to write a script
I'm going to maximize it so again uh as we will be using uh we'll be using shiny so we need to tell our about the that we will be using shiny so it's better to upload the library of shine
and after that what I will do I will also try to get uh the working so because I will be uploading uh I will be importing the dataset from a folder so it's better to set my working directory to so to do that I will set working directory wd and then I need to put down the folder path here I will go back to my folder I will just copy the path paste here I just need the path no need to mention the file name
so this is my folder part now
so I'm going to save my file again to the
#slideinput #rshiny #rstudio
R Shiny Playlist: • Learn Building R Shiny Dashboard with Us
In questa pagina del sito puoi guardare il video online 5. How to add SliderInput functionality in R Shiny with adjustable data range selection? della durata di ore minuti seconda in buona qualità , che l'utente ha caricato Learn data analytics with us 01 gennaio 1970, condividi il link con amici e conoscenti, su youtube questo video è già stato visto 2,414 volte e gli è piaciuto 22 spettatori. Buona visione!