R GRAPHICS TRICK !!!
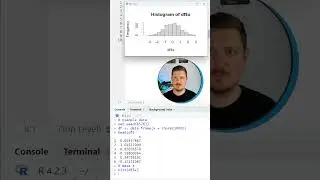
How to divide a ggplot2 scatterplot into groups using the facet_wrap() function in the R programming language.
R code of this video:
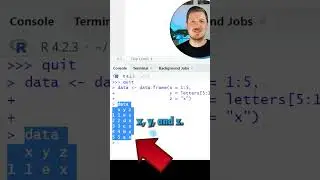
set.seed(7462722)
data <- data.frame(
x = c(rnorm(300),
rnorm(300, 3, 2),
rnorm(300, 0, 5)),
y = c(rnorm(300),
rnorm(300, 1, 5),
rnorm(300, 3, 0.5)),
group = rep(LETTERS[1:3],
each = 300)
)
library("ggplot2")
ggp <- ggplot(data, aes(x, y)) +
geom_point()
ggp
ggp +
facet_wrap(group ~ .)
Follow me on Social Media:
Facebook – Statistics Globe Page: / statisticsglobecom
Facebook – R Programming Group for Discussions & Questions: / statisticsglobe
Facebook – Python Programming Group for Discussions & Questions: / statisticsglobepython
LinkedIn – Statistics Globe Page: / statisticsglobe
LinkedIn – R Programming Group for Discussions & Questions: / 12555223
LinkedIn – Python Programming Group for Discussions & Questions: / 12673534
Twitter: / joachimschork
Music by bensound.com
Nesta página do site você pode assistir ao vídeo on-line R GRAPHICS TRICK !!! duração hora minuto segundo em boa qualidade , que foi baixado pelo usuário Statistics Globe 27 Abril 2023, compartilhe o link com seus amigos e conhecidos, no youtube este vídeo já foi visto 1,359 vezes e gostou 79 espectadores. Boa visualização!